PMP - OTHER TOPICS -> Difference between Vision and Mission
PMP - OTHE TOPICS -> Difference Product and Project manager
Hi I am Avinesh Singh from http://pmptrack.com
The PMP aspirants would definitely look for a very good explanation of the 7 basic quality tools and their applications. My best efforts to provide you the information from various sources on internet.
MEASURING VARIATION
First I would start with the topic, measuring variation because the quality topic is aligned on meeting the baseline and controlling the variation and identifying or measuring the extent of variation:
I would cover the following :
Understanding variation: Key principles of this important topic.
Measuring variation: Principles of measurement of variation.
Measuring centering: Mean, median and mode.
Measuring spread: Range and standard deviation.

Hope this was useful
PMP - OTHE TOPICS -> Difference Product and Project manager
The PMP aspirants would definitely look for a very good explanation of the 7 basic quality tools and their applications. My best efforts to provide you the information from various sources on internet.
MEASURING VARIATION
First I would start with the topic, measuring variation because the quality topic is aligned on meeting the baseline and controlling the variation and identifying or measuring the extent of variation:
I would cover the following :
Understanding variation: Key principles of this important topic.
Measuring variation: Principles of measurement of variation.
Measuring centering: Mean, median and mode.
Measuring spread: Range and standard deviation.
The
continuously variable nature of the universe is at the heart of the science of
statistics, and at first glance can look very complex, particularly if
approached from a mathematical viewpoint. This can lead to it being ignored,
which is a pity, as even a simple appreciation of it can result in a reduction
in haphazard attempts to control it, with a consequent saving in wasted time
and degraded performance.
When a
process is executed repeatedly, its outputs are seldom identical. For example,
when a gun is successively fired at a target, as in Fig. 1, the bullets will
not all pass through the same hole.
Fig. 1. Variation in targeted results
This lack
of repeatability is caused by the variation or variability in
the process. If these causes are understood, then this can lead to the
development of solutions to reduce the variation in the process and result in
more consistent products which require less inspection and testing, have less
rejection and failure, cost less to build, have more satisfied customers and
are more profitable.
Variation
in process output is caused by variations within the process. These may be one
or more of:
- Differing
actions within the process.
- Differing
effects within the process.
- Differing
inputs to the process.
As an
example for each of these conditions, the variation in the placement of the
bullet holes in the target may be affected by:
- The
gun being held or used differently.
- Wear
in the hammer mechanism causing the shell to be struck differently.
- The
bullets being of slightly differing shape or weight.
Thus,
even if the first point is eliminated by putting the gun in a clamp and firing
it remotely, the bullets will still not all hit the target in the identical
position.
The
reasons why variation occurs can be divided into two important classes, known
as common and special causes of variation. These are discussed further below.
Within
any process there are many variable factors, as indicated above, each of which
may vary a small amount and in a predictable way, but when taken together
result in a degree of randomness in the output, as indicated in the figure
below. These seemingly uncontrollable factors are called common causes
of variation.
Common
causes of variation can seldom be eliminated by 'tampering' with the process.
For example, consider the effect of simple adjustments to the clamped gun, as
in the figure below.
Fig. 2. Tampering
- The
first hole is to the left of center, so the clamp is rotated a little to
the right.
- If
the clamp had been left alone, the second bullet would have gone a little
to the right of center, but as it has been moved right, the bullet now
goes further to the right. As a reaction to this, the clamp is rotated
somewhat more to the left.
- The
third bullet tends towards the left anyway, so the result is a hole even
further to the left.
It can be
seen from this that it would have been better not to tinker with the clamp, and
that the score would be more likely to improve if the whole system were understood
first and then fundamental improvements made, such as building a better gun or
making better bullets.
Special
causes of variation are unusual occurrences which come from outside the normal
common causes, for example where a shot goes outside the main grouping, due to
someone tripping over the gunner as the gun is fired, as below:
Fig. 3. Special and common causes of variation
Special
causes can thus be addressed as individual cases, finding the cause for each
occurrence outside the normal grouping and preventing it from recurring. This
may be contrasted with the way that common causes must be addressed through the
overall process.
The way
that causes are addressed in a process improvement project is usually first to
recognize and eliminate special causes, and then to find ways of improving the
overall process in order to reduce common causes of variation.
The
distribution of measurements as described above takes no account of time or
sequence, as it is not important which measurement came first or last. This isstatic variation.
If the
order in which measurements are made is known, then significant trends may be
detected, which may be useful for catching a problem before it becomes serious.
This is dynamic variation.
For
example, if the gunner is initially accurate, but becomes less so as his arm
tires, then this may not be detected from the final positioning of holes on the
target - it could only be seen by plotting the positioning of the holes across
time.
Dynamic
variation is commonly measured using the Control Chart.
Measuring variation
Variation is not simple to measure, as by its nature is random and individual events cannot be predicted. Despite this, a degree of measurement can be achieved by looking at how a number of measurements group together. Usually these items are selected with sampling methods.
The spread of measurements within a group enables special causes of variation to be distinguished from common causes of variation. Beyond this, the characteristics of how these random events are spread out can allow improvements in seemingly random chaos to be simply measured.
Distribution of results
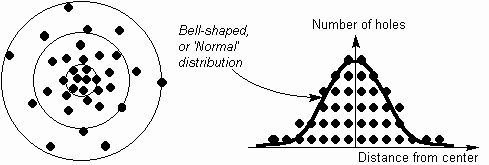
It is common in processes for most measurements to cluster around a central value, with less and less measurements occurring further away from this center. For example, the distribution of holes across the target will gradually spread out from a central, most common placement, as below:

The Normal distribution
The bell-shaped curve in the figure above occurs surprisingly often and is consequently called a Normal distribution (or Gaussian distribution, after its discoverer) and has some very useful properties which can be used to help variation be understood and controlled.
Other distributions
A Normal distribution of measurement values does not always occur, and other distributions may be caused by various factors, conditions and combinations. Several of these are discussed in Chapter 23. It is a trap to use tools that expect a Normal distribution, such as Process Capability, when the distribution is not Normal.
The Central Limit Theorem
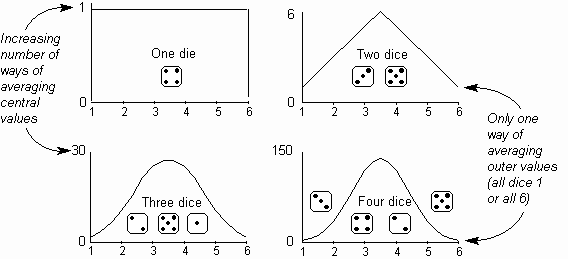
The reason for the common occurrence of this Normal distribution is either a natural distribution or the very useful and remarkable effect described by the Central Limit Theorem. This states that, even where the underlying population distribution is not normal, the distribution of the averages of a set of samples will be approximately normal.
This is clearly illustrated below, which shows the distribution of average values achieved by throwing all possible combinations of one, two, three and four dice.

With a single die, the distribution is rectangular, as there is one, equally likely way of achieving each number. With two dice, the distribution becomes triangular, as although there is only one way of averaging one (two ones), there are six ways of averaging the central value of 3.5 (1-6, 2-5, 3-4, 4-3, 5-2 and 6-1).
With three dice, the distribution becomes curved, and with four dice it is markedly bell-shaped, as there is still only one way of averaging one, but there are four ways of averaging 1.25 (three 1s and a 2) and so on up to 147 ways of averaging 3.5! A key use of this effect is that a predictable Normal distribution can be produced by measuring samples in groups of as few as four items at a time.
Measuring distribution
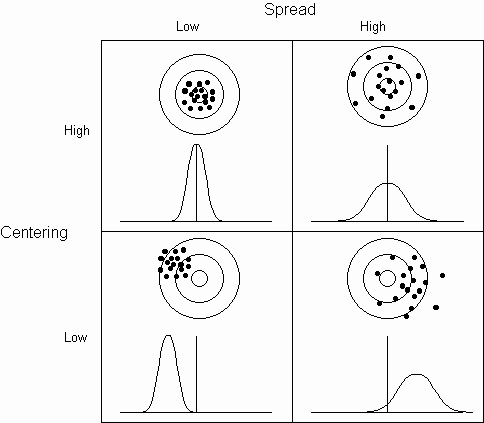
The measurements of a process can vary in two different ways, in terms of their centering and their spread, as illustrated below:

The centering (also called accuracy or central tendency) of a process, is the degree to which measurements gather around a target value. The spread (also calleddispersion or precision) of the process is the degree of scatter of its output values.
Measuring centering
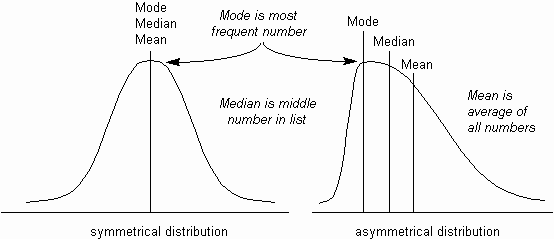
To measure the centering of a process requires that the center point of the set of results be identified. The accuracy of the process can then be determined by comparing it with target values. There are three ways of measuring this center point: the mean (or average), the median and the mode (see the figure below).

Fig. 1. Mean, median and mode in distributions
Mean
The most common way of measuring the center point of a set of measurements is with the average, or mean (i.e. the sum of all measurements divided by the total number of measurements).
The mean is useful for further mathematical treatment, as it considers all values (although a few extreme values can cause the mean to become unrepresentative of the rest of the values).
Median
If the measurements are listed in numeric order, then the median is the number half-way down the list. If there is an even number of measurements, it is half-way between the middle two numbers. The median is not distorted by extreme values, but it can be very unrepresentative of the other values, particularly in a distribution which is not symmetrical.
Mode
The mode is the most commonly occurring measurement. In a distribution graph, this is the highest point. The mode is also not distorted by extreme values, and is useful for measuring such as average earnings. However, there can be more than one mode, and it is not as good as the mean for mathematical treatment.
In a symmetrical distribution such as a Normal distribution, these three measures are the same. In an asymmetrical (or skewed) distribution, as below, there is a simple rule-of-thumb formula which can be used to estimate one, given the other two:
Mean - Mode = 3 x (Mean - Median)
Measuring spread (Range and Standard Deviation)
There are two main ways of measuring the degree of spread of a set of measurements: the range and the standard deviation.
Range
The range of a set of measures is simply the difference between the largest and the smallest measurement value.
Thus, for example, if you have a set of measures (21, 22, 26, 19, 12, 24, 33) then you first find the highest measure (33) and subtract the lowest measure (12) to give the range (21).
This is easy to calculate, but there can be several problems with using it:
- Special causes of variation can cause an unrealistically wide range.
- As more measurements are made, it will tend to increase.
- It gives no indication of the data between its values.
Standard deviation
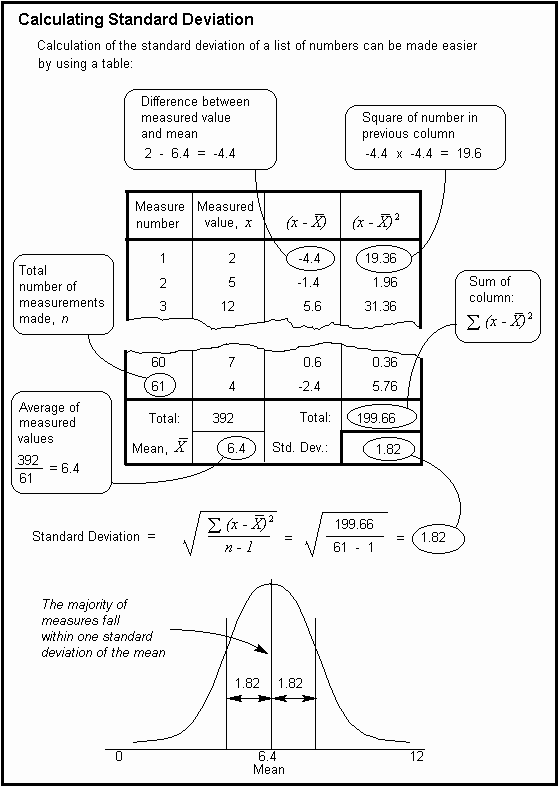
The standard deviation is a number which is calculated using a simple mathematical trick (calculating the square root of the average of squares) to find an 'average' number for the distance of the majority of measures from the mean.
The standard deviation is of particular value when used with the Normal distribution, where known proportions of the measurements fall within one, two and three standard deviations of the mean, as below.

Fig. 1. Percentages in Normal Distribution between Standard Deviations
Thus, given a set of measures, the mean and the standard deviation can be calculated, and from this can be derived the probability of future measures falling into the three bands, provided that the distribution is normal (a simple visual test for this is to draw a histogram and look for the bell shape).
For example, if the gunner has an average score of 56 per target card, with a standard deviation of 6, then, provided the distribution is normal:
- 68.3% of scores will be 56 ± 6 (= between 50 and 62)
- 95.4% of scores will be 56 ± 12 (= between 44 and 68)
- 99.7% of scores will be 56 ± 18 (= between 38 and 74)
or, breaking out the six bands:
- 2.1% of scores will be between 38 and 44
- 13.6% of scores will be between 44 and 50
- 34.1% of scores will be between 50 and 56
- 34.1% of scores will be between 56 and 62
- 13.6% of scores will be between 62 and 68
- 2.1% of scores will be between 68 and 74
- The remaining 0.3% of scores will be below 38 or above 74.

Hope this was useful


No comments:
Post a Comment